Lychee EVM Functions and Operation Method
❏ What is Lychee EVM?
Lychee EVM is a plugin which aggregates and calculates EVM (Earned Value Management) based on the deadlines and man-hours data registered for an issue, and displays it as a graph.
Based on the EVM, you can also calculate and graph SPI (Schedule Performance Index) and CPI (Cost Performance Index).
❏ Displaying EVM
Clicking on "EVM" in the Project menu will display the EVM.
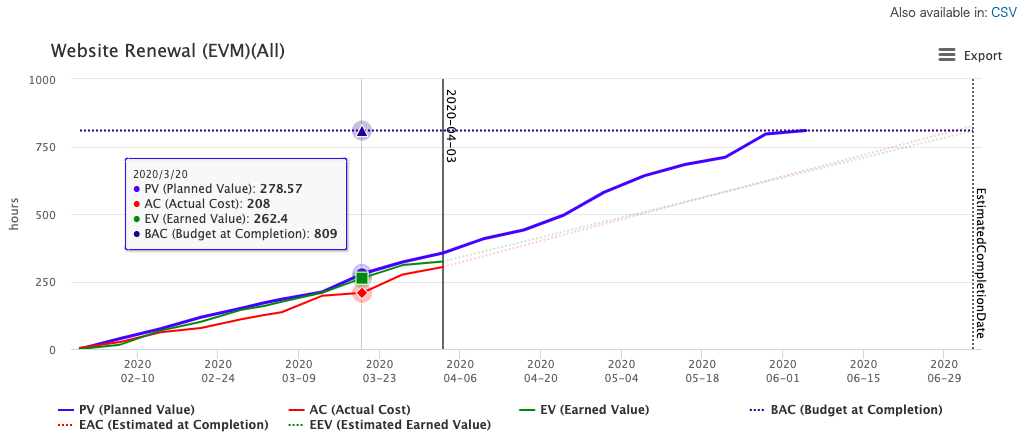
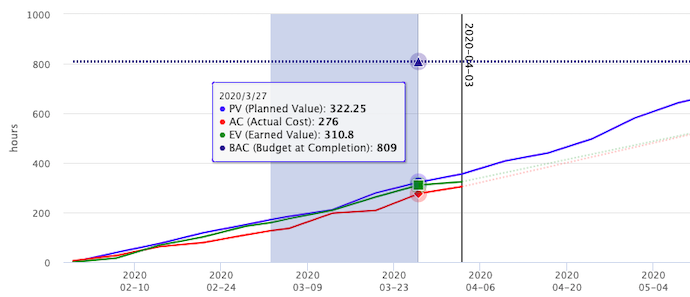
❏ Calculation Method for Basic Indicators
| Indicator | Meaning | Calculation Method |
|---|---|---|
| PV (Planned Value) | Planned value | Cumulative total "Estimated time" based on each issue's deadline |
| AC (Actual Cost) | Actual cost incurred | Cumulative total "Spent time" for each issue |
| EV (Earned Value) | Completed results | Cumulative total of actual results calculated from each issue's progress rate and estimated time. If using Lychee Actual Date, the actual start and due dates are used as the reference dates for assigning EV. |
| BAC (Budget at Completion) | Total budget at end of project | PV at the project's planned end date |
| EAC (Estimated at Completion) | Costs at completion estimated from AC | EAC = AC + { (BAC - EV) / CPI } |
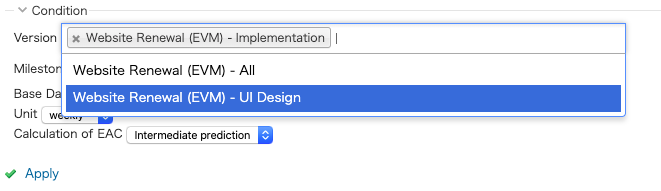
❏ Selecting Versions to be Displayed
Using the form at the top of the screen, you can select which versions will have their EVM displayed.
Selecting "[Project Name] - All" will display an EVM which includes all versions within a project.
You can also select multiple versions.
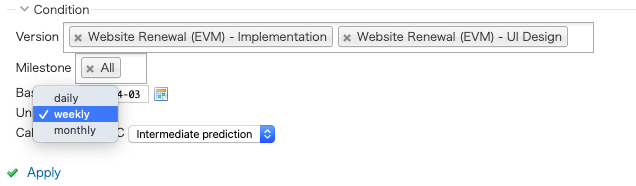
❏ Selecting Base Date, Display Unit
Using the form at the top of the screen, you can select the Base Date and Unit to be used when
displaying the EVM. Selecting a base date will the show the EVM at that point in time.
You can select Daily, Weekly, or Monthly as the unit along the x-axis of the EVM.
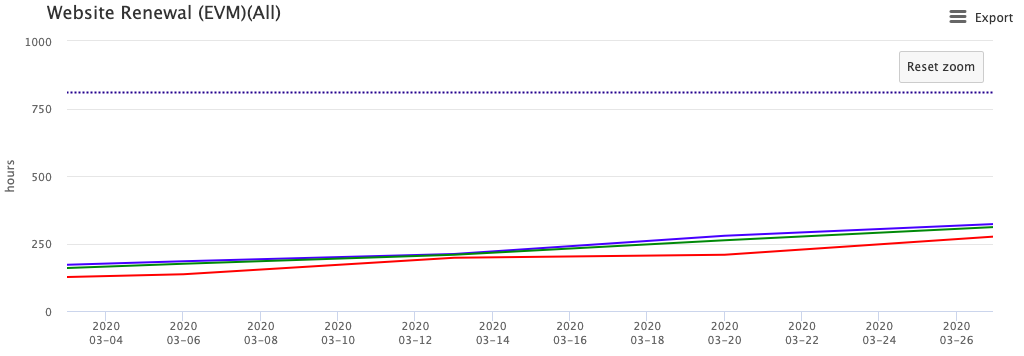
❏ Zoom
Mousing over the EVM, you can drag-and-drop to zoom in on a specific part of the chart. To exit the zoomed view, click on the "Reset zoom" button displayed at the top right of the EVM.
Click to select an area to zoom in
Zoomed-in section of EVM
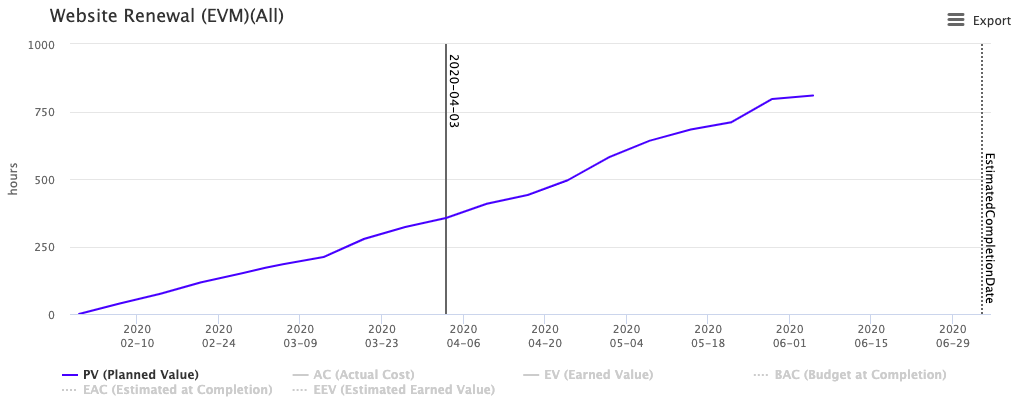
❏ Displaying Selected Charts
Clicking on the chart names in the legend at the bottom of an EVM allows you to change the display status (On/Off) for each chart.
Example: Only PV displayed
❏ SPI+CPI Display
SPI+CPI is displayed below the EVM.
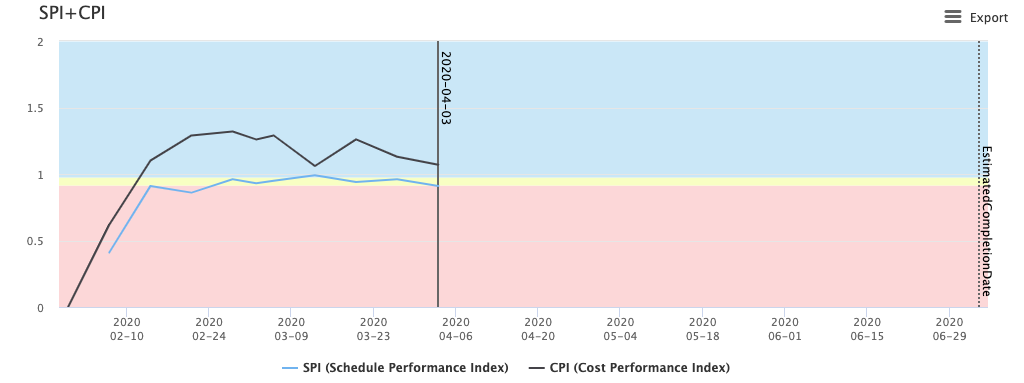
❏ Calculation Method of SPI, CPI
| Indicator | Calculation Method |
|---|---|
| SPI (Schedule Performance Index) | SPI = EV / PV |
| CPI (Cost Performance Index) | CPI = EV / AC |
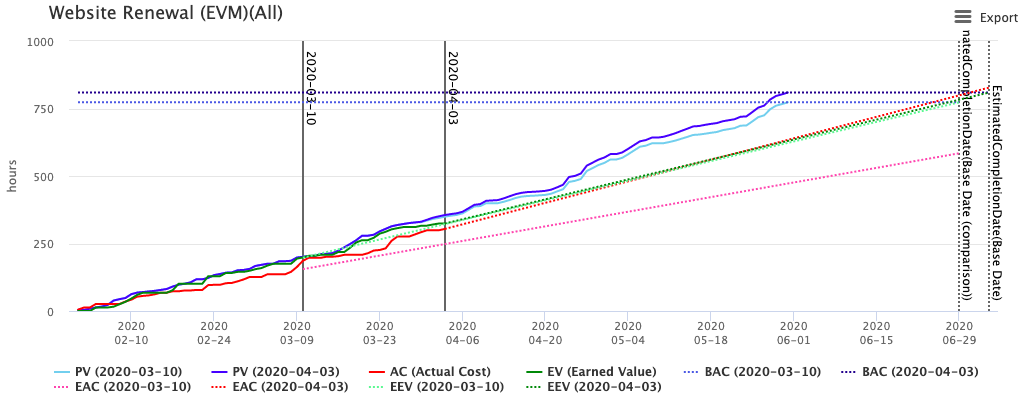
❏ Baseline Comparison
Selecting "Comparison" under Type in the form at the top of the screen allows you to enter two base dates for comparison. Clicking the "Apply" link will display EVMs for the two base dates overlaid on top of each other.
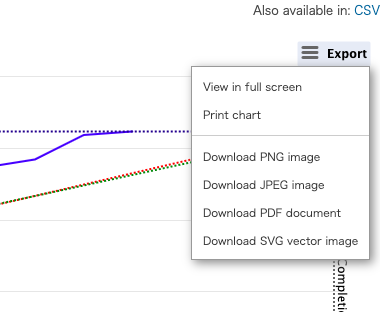
❏ Exporting
Clicking the CSV link at the top right of an EVM chart allows you to download the EVM data in CSV format.
Clicking the Export link allows you to print the EVM or select an image format to download it as an image.
❏ Revising Progress for Past Dates
With the proper permissions, you can revise progress rates as well as input actual man-hours for past dates.
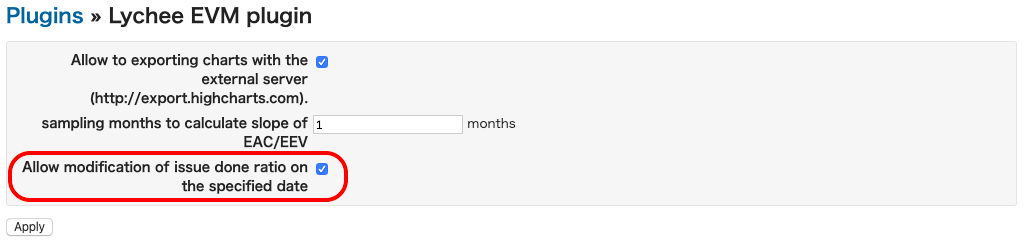
a.Plugin Settings
Under the Administration > Plugins > Lychee EVM plugin Configure, check the box marked "Allow modification of issue done ratio on the specified date".
*Disabled by default.
b.Revising Progress
Progress can be revised on the Log time screen.
If "Use the issue field" is selected as the "Calculate the issue done ratio with" under Administration > Settings > Issue tracking:
Specify the issue number and date, and then make any desired changes to "% Done".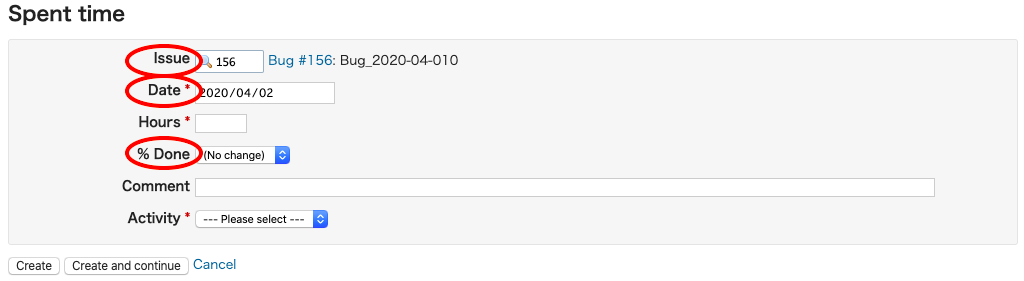
If "Use the issue status" is selected as the the "Calculate the issue done ratio with" under Administration > Settings > Issue tracking:
Specify the issue number and date, and then make any desired changes to "Status”.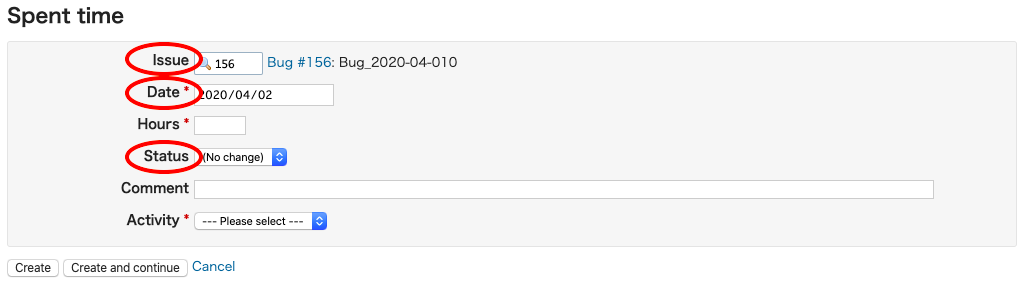
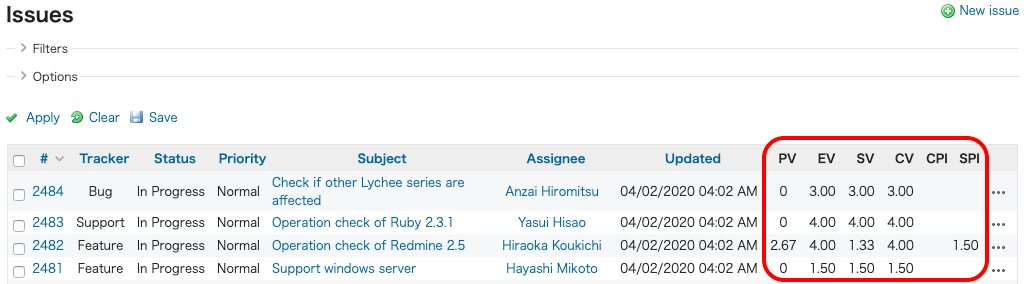
❏ Displaying EVM Values on the Issue List Screen
On the Issue List screen, you can check EVM values (PV, EV, SV, CV, SPI, CPI) for each issue.
Check the "Lychee EVM" box on the Projects > Settings > Project > Module frame.
Projects > Issues will display the Issue List screen.
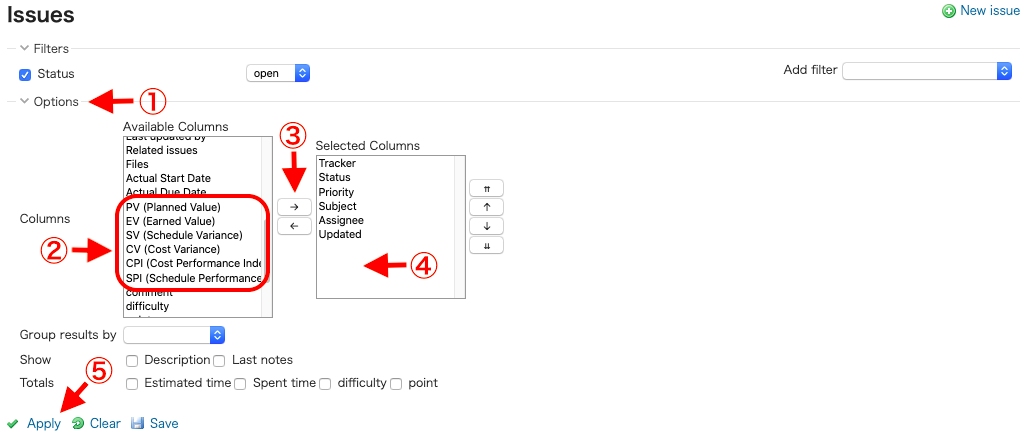
- Click "Options" to expand the section.
- Then select optional values such as "PV, EV, SV, CV, SPI, CPI" from the "Available Columns" pane.
- Click the → button to add.
- Them to the "Selected Columns" pane.
- Finally, clicking "Apply" will add them to the list.