Lychee Project Report Functions and Operation Method
❏ What is Lychee Project Report?
Lychee Project Report allows you to check project statuses across several projects at once.
This plugin visualizes the progress, quality, and costs of projects, while also allowing you to manage the status of projects and support problem resolution.
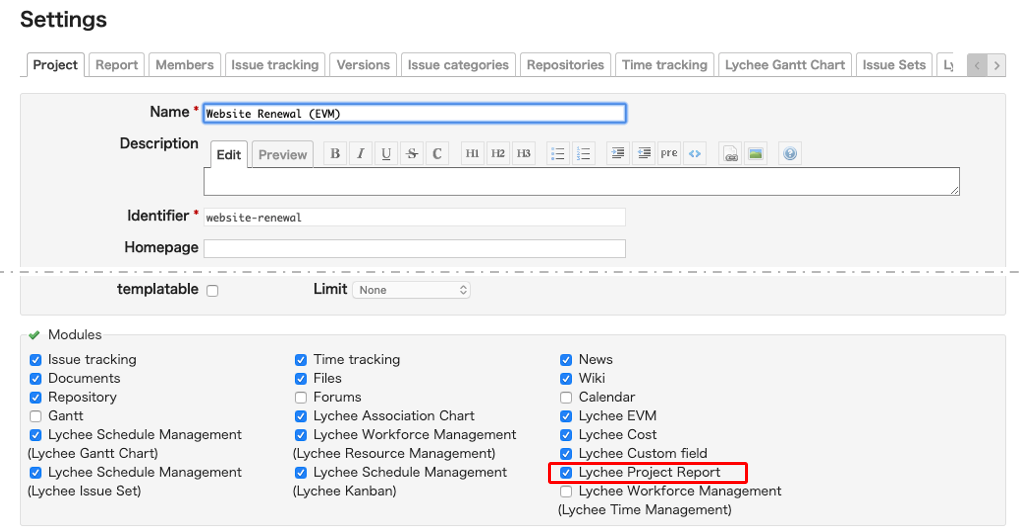
❏ Project Settings
You can select which projects are included in Project Report by checking or unchecking the "Lychee Project Report" checkbox under the Projects > Settings > Project tab. Projects which have the box checked will be included in Project Report.
*Projects which have the "Lychee Project Report" box checked will not be displayed on the Overall Project Report screen after they have been archived.
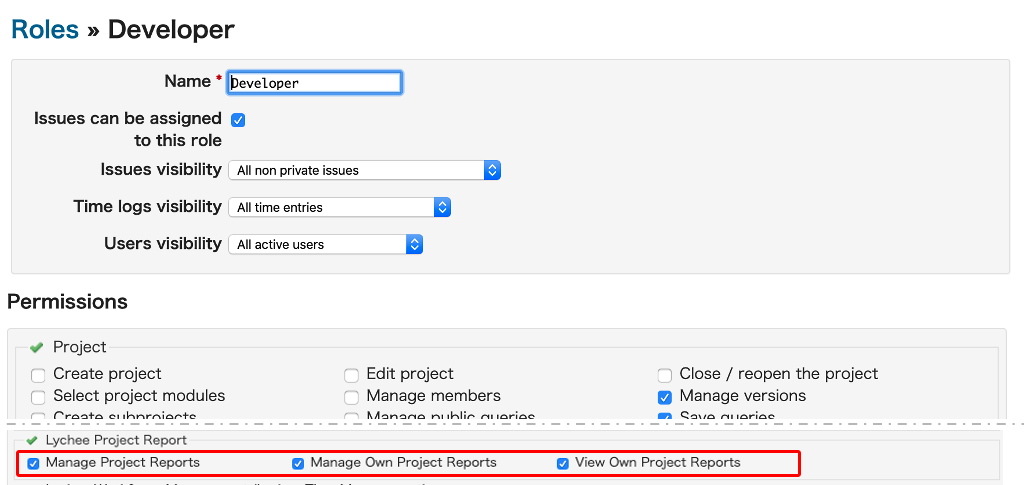
❏ Setting Permissions
In order to be able to use Lychee Project Report, the appropriate permissions must be selected in the "Lychee Project Report" section under Administration > Roles and permissions.
Without the proper permissions, you cannot view the Project Report screen.
❏ Setting Indicators
In order to display a Project Report, you must first set indicators.
Clicking on "Indice Settings" at the top right of the Overall Project Report screen will display the Indicator Settings screen. On the Indicator Settings screen, you can perform settings for the following 3 types of indicator.
- Progress Indicators
- Quality Indicators
- Cost Indicators
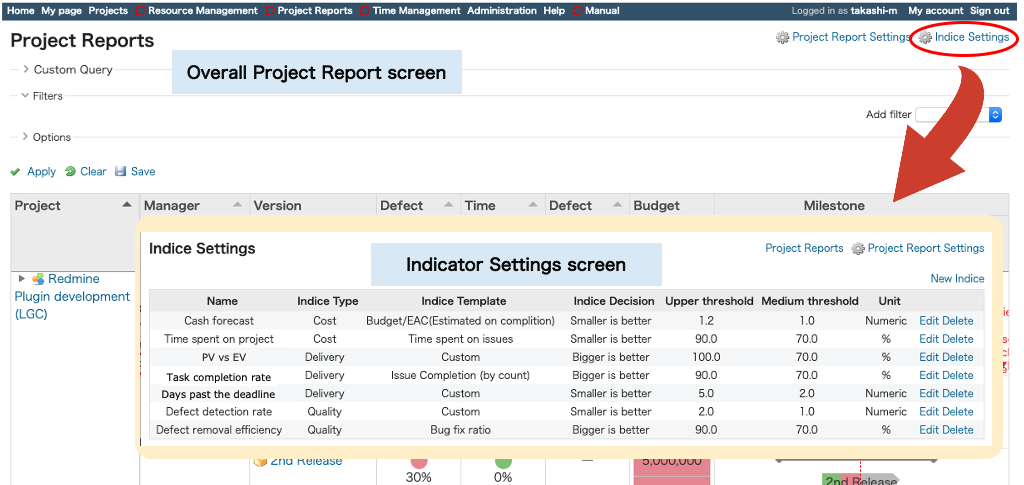
❏ Creating a New Indicator
You can create a new indicator by clicking "New Indice" at the top right of the Indicator Settings screen.
【Issue Filter:】
You can set the following issue filter:
- Status
- Tracker
- Priority
- Estimated time
- %Done
- Custom field items
a) Delivery Indicators
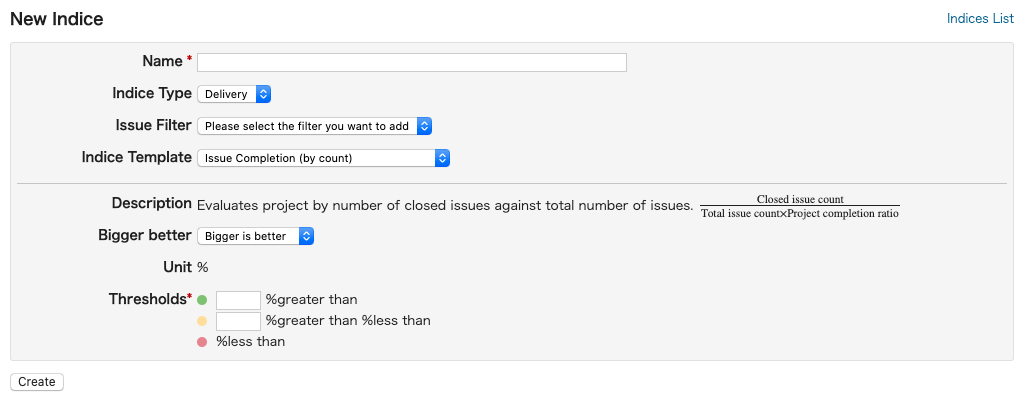
【Indice Template:】
You can select the following indicator templates from the pull-down menu:
| Template | Description |
|---|---|
| Issue Completion(by count) | This progress indicator determines %Done based on the ratio of closed issues to total issues and the number of days the project has been running. |
| Issue Completion(by estimated hours) | This progress indicator determines %Done based on the ratio of total estimated hours for closed issues to the total estimated hours for all issues and the number of days the project has been running. |
| Issue Completion(by done ratio*estimate) | This progress indicator determines %Done based on %Done of each issue compared to the total estimated hours for all issues and the number of days the project has been running. |
| Custom | You can measure progress using custom fields for issues and projects or any other items shown in the options. |
【Bigger better】
You can set the criteria for each project. When the indicator value is Good it is displayed in green, when it is Dangerous it is displayed in red.
| Criterion | Description |
|---|---|
| Bigger is better | If the indicator value is greater than the criterion value, it is displayed on the report screen in green (Good) |
| Smaller is better | If the indicator value is less than the criterion value, it is displayed on the report screen in green (Good) |
【Thresholds】
You can set criteria values for each project.
Example: *If you set the Bigger better to "Bigger is better"
- Displayed as green light if "%greater than": Good
- Displayed as red light if "%less than": Dangerous
b) Quality Indicators
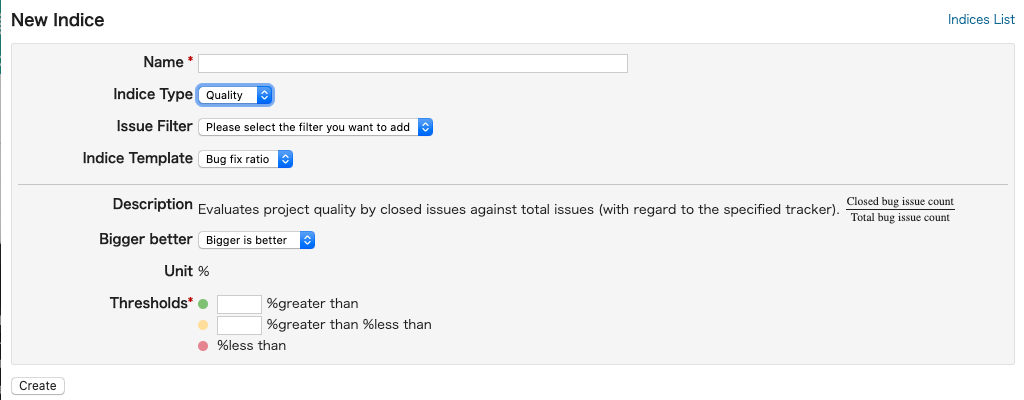
【Indice Template:】
You can select the following indicator templates from the pull-down menu:
| Template | Description |
|---|---|
| Bug fix ratio | This quality indicator determines quality by taking the ratio of fixed bugs to total bugs and applying it to the number of planned issues for a given tracker. |
| Custom | You can measure quality using custom fields for issues and projects or any other items shown in the options. |
c) Cost Indicators
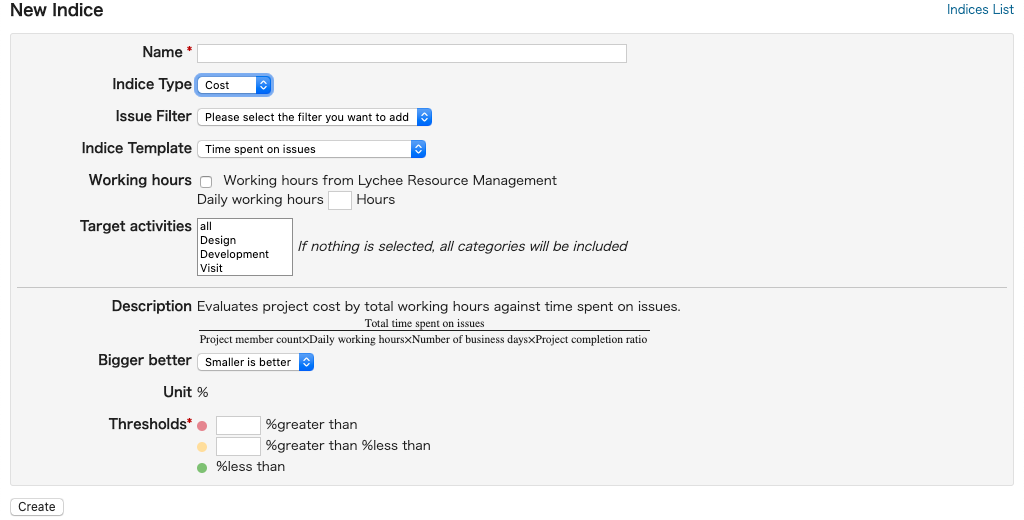
【Indice Template:】
You can select the following indicator templates from the pull-down menu:
| Template | Description |
|---|---|
| Planned Issue Completion Rate Base | This cost indicator determines cost by taking the ratio of actual man-hours to project members' total hours and applying it to the planned number of completed issues. |
| Custom Field | You can measure costs using custom fields for issues and projects or any other items shown in the options. |
❏ Displaying Indicators on the Report Screen
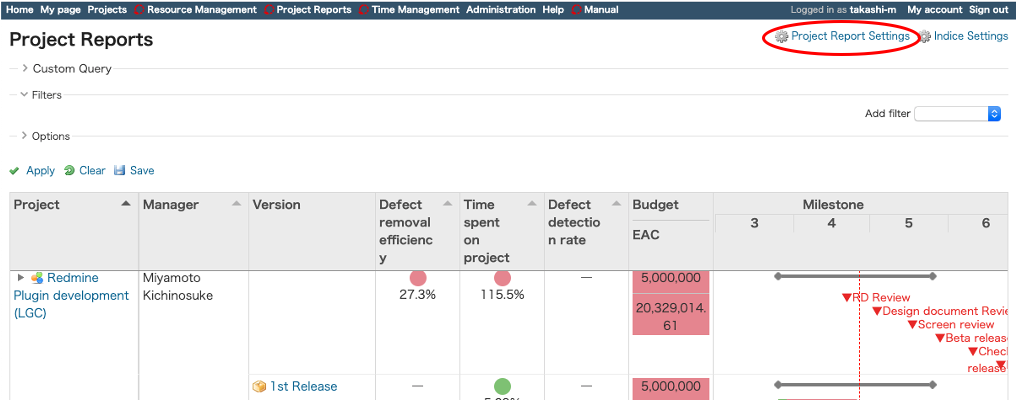
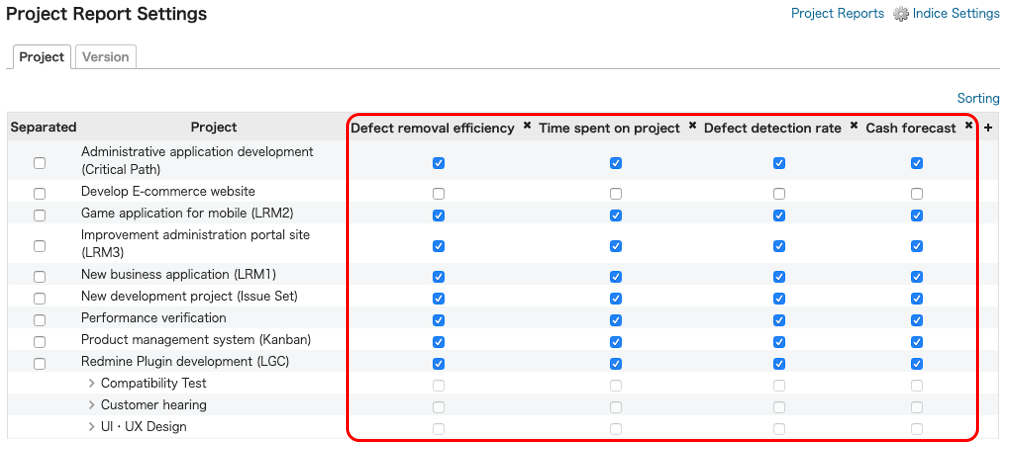
For each project and version, you can assign optional evaluative indicators when you create a report. Clicking on "Project Report Settings" in the top right of the Project Report screen will take you to the Project Report Settings screen, where you can assign indicators.
Evaluation values are displayed in rows for each indicator you set.
a) Setting indicators for projects
After creating evaluative indicators in Indice Settings, you can assign them to various projects and they will be reflected in the Project Report screen.
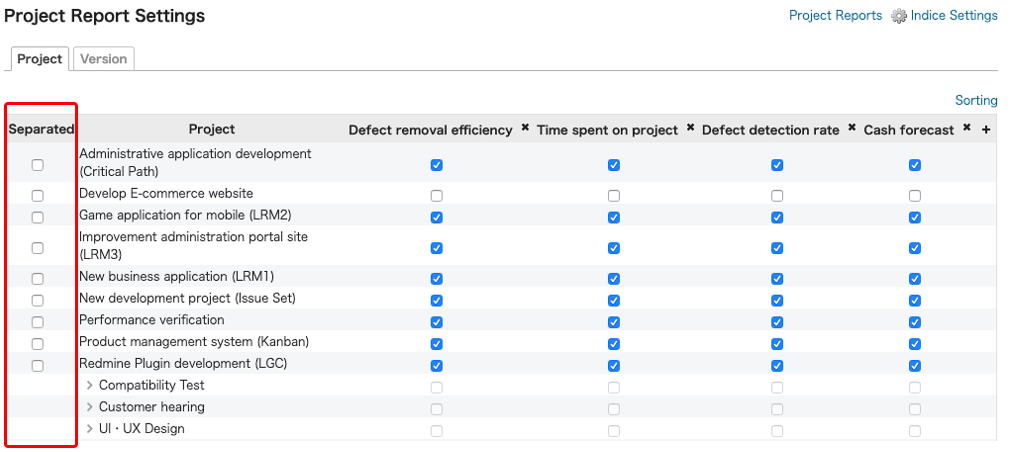
b) Assigning different indicators to parent and sub-projects
You can set indicators for a sub-project different from those of its parent project by checking its box in the Separate column and assigning indicators to that sub-project.
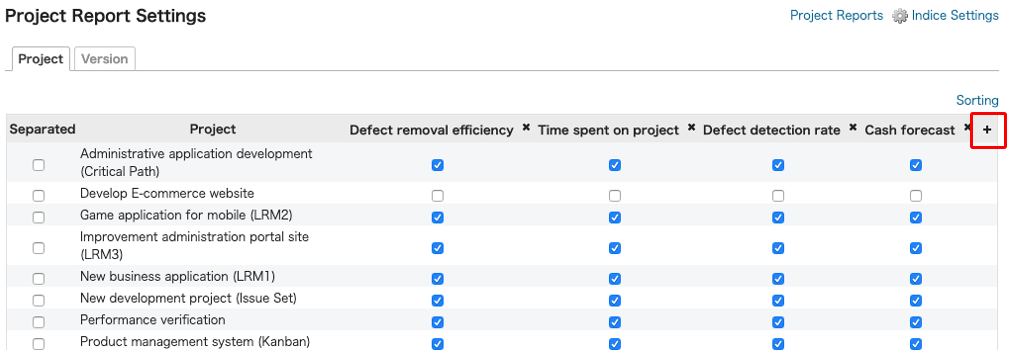
c) Adding indicators
You can add indicators by clicking the "+" symbol in the top right corner.
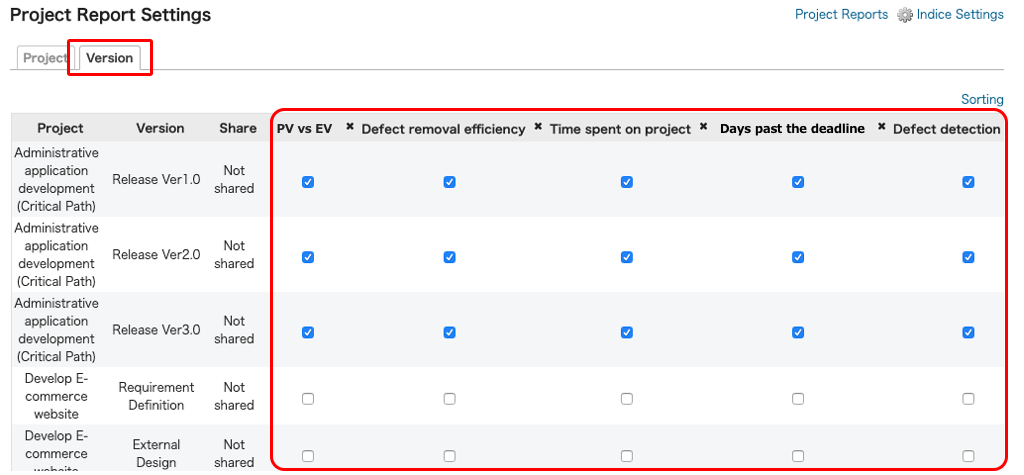
d) Setting indicators for versions
You can set indicators for versions by selecting the "Version" tab in the top left.
Any indicators you assign will be reflected in the Project Report screen.
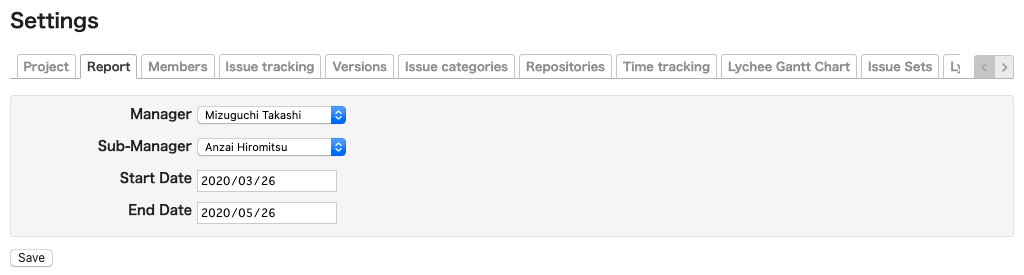
❏ Settings for Each Project
You can change the following settings on each project's Settings > Report tab.
Here, the Elapsed Work Days Percentage is calculated from the Start Date and End Date specified in the settings. This percentage is used to further calculate many indicators.
- Manager
- Sub-Manager
- Start Date (project start date)
- End Date (project end date)
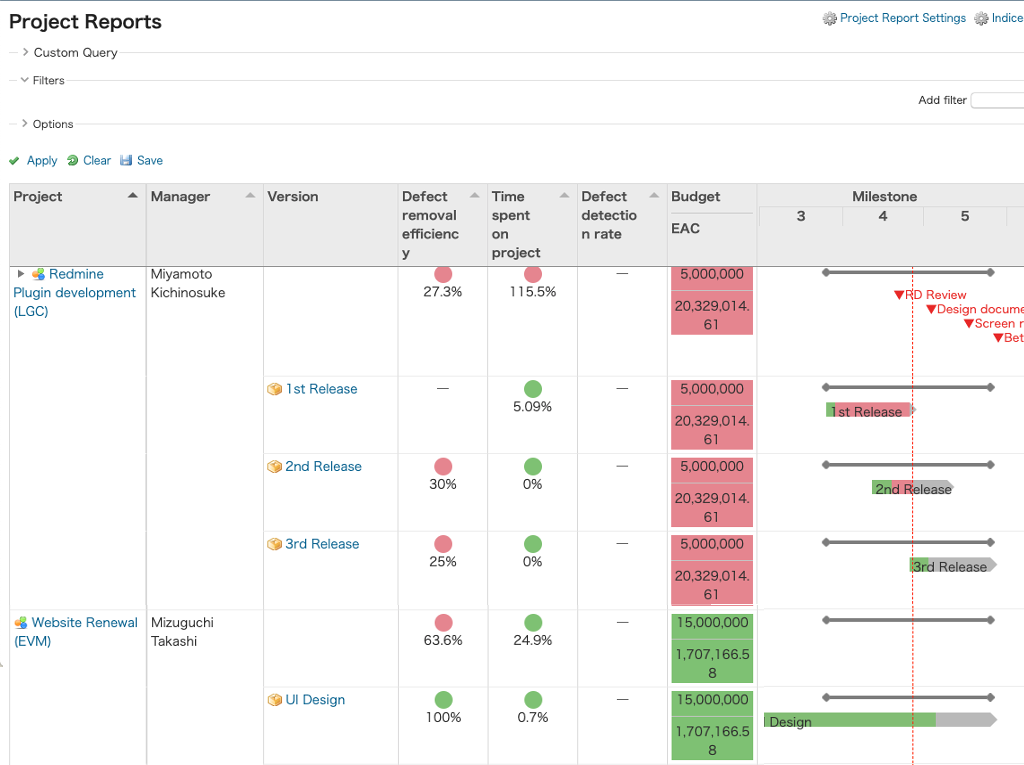
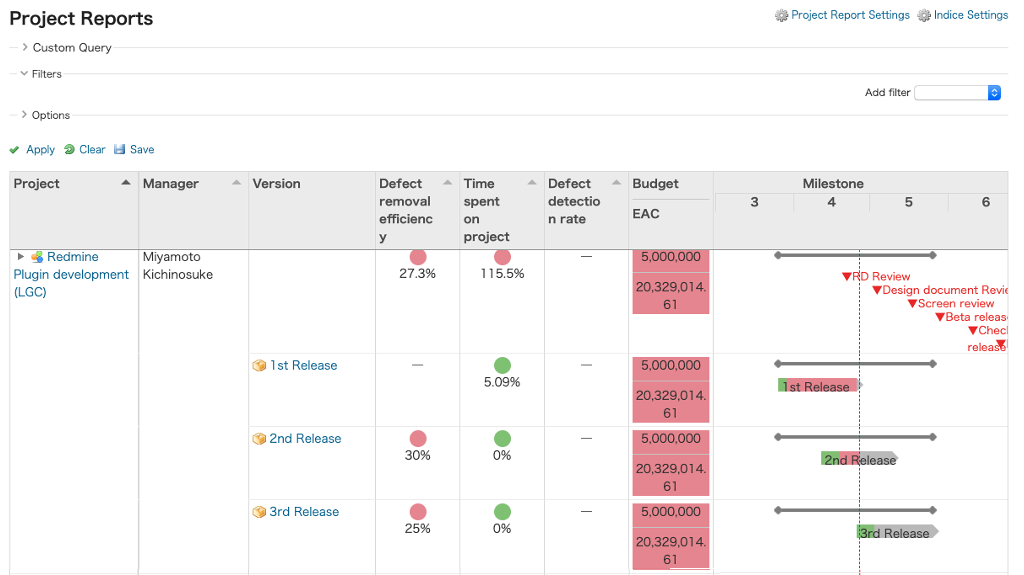
❏ Overall Project Report Screen
Clicking on "Project Reports" in the top menu will display the Overall Project Report screen.
The Overall Project Report screen allows you to look at a cross-section of the statuses of several projects. The status of each project's progress, quality, and cost is displayed using traffic lights.
- Red light: Dangerous
- Yellow light: Caution
- Green light: Good
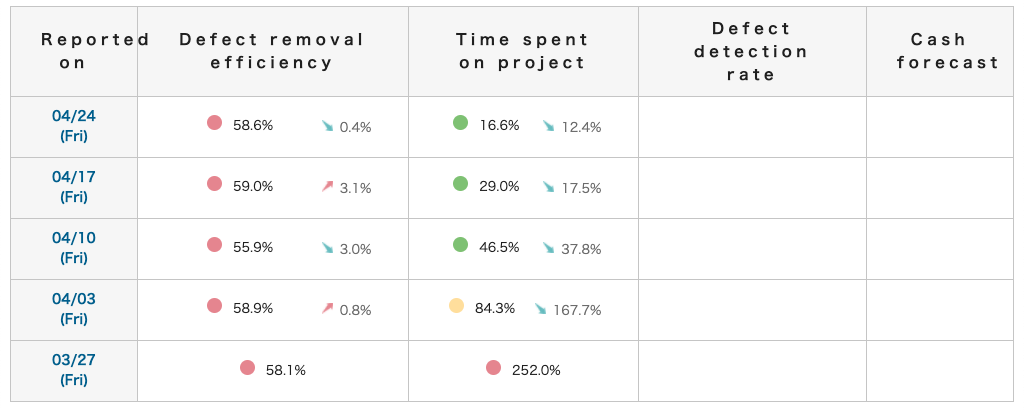
❏ Individual Project Report Screen
Clicking on a project name on the Overall Project Report screen will display an Individual Project Report screen.
The Individual Project Report screen allows you to look at the project's overview and the numerical values for each indicator.
1. For each indicator, the current value and the difference from the last reported value are displayed.

2. Clicking on the pencil icon to the right of each indicator title in the report will allow you to enter comments on that indicator.
3. Clicking "Recalculate" in the top right of the Individual Project Report will recalculate the status of the project based on the current statuses of issues.
4. Clicking "History" in the top right of the Individual Project Report will allow you to check the history of reports generated in the past.
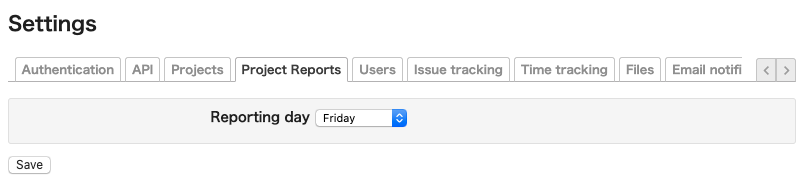
You can select which day of the week weekly reports are generated on by going to Administration > Settings > Project Reports tab.
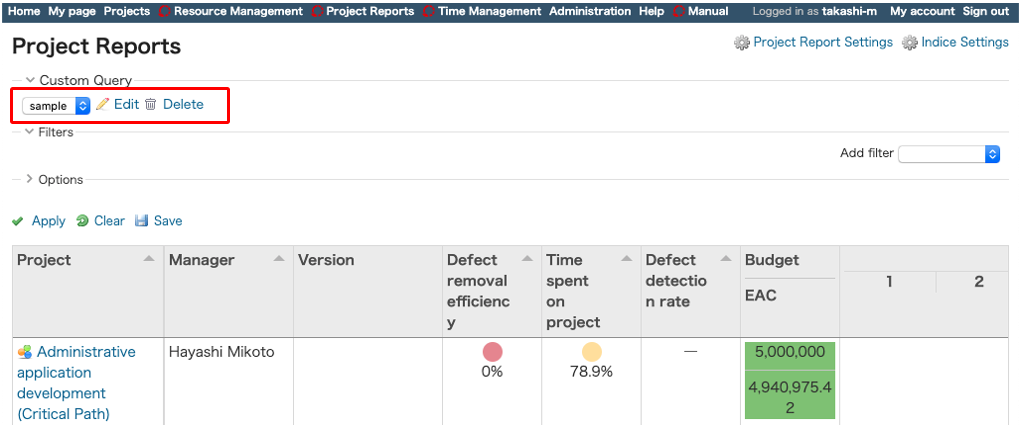
❏ Saving Queries
You can save which items are displayed on the Overall Project Report screen and their sorting conditions as a Custom Query.
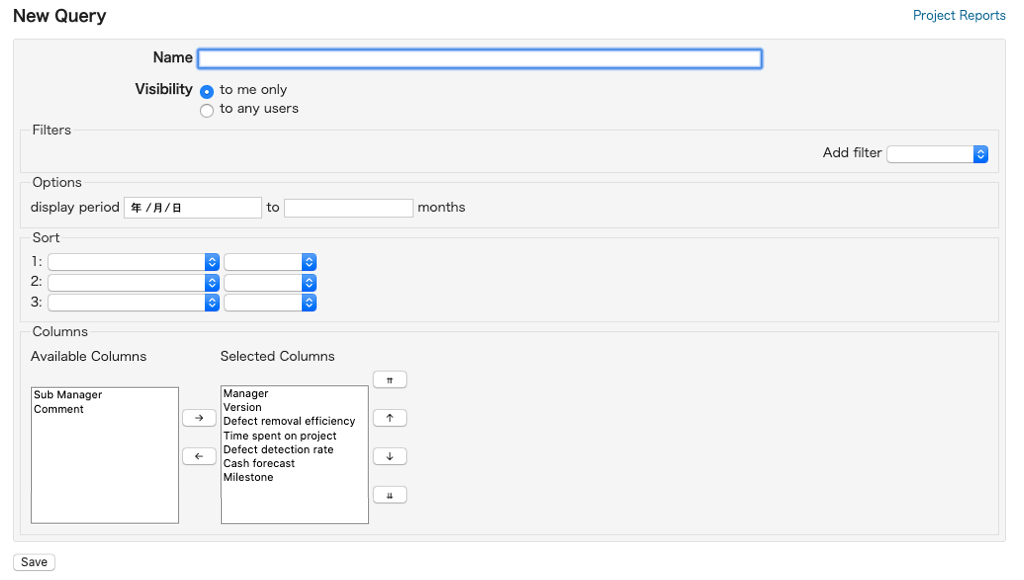
a) Creating a Custom Query
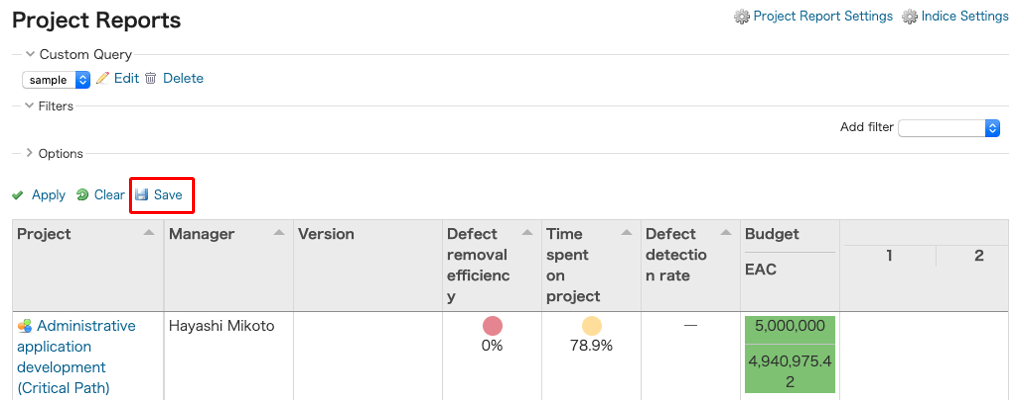
After navigating to the query input screen, input the necessary information and click the "Save" button.
b) Editing/Deleting Queries
You can edit or delete queries you have created by opening the Custom Query menu at the top left of the Overall Project Report screen and clicking on the "Edit" or "Delete" links.